
Category:Ocean acidification
climate change-induced decline of pH levels in the ocean .png) | |||||
| Upload media | |||||
| Subclass of |
| ||||
|---|---|---|---|---|---|
| Facet of | |||||
| |||||
Media in category "Ocean acidification"
The following 51 files are in this category, out of 51 total.
-
 A pteropod shell is shown dissolving over time.jpg 1,920 × 1,080; 865 KB
-
 Acidifiedupwelledwater.jpg 1,423 × 1,974; 3.06 MB
-
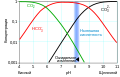
 AnteileDerKohlensäureformen.svg 1,097 × 1,048; 7 KB
-
 Cambiamenti climatici e effetti sull'oceano.png 785 × 550; 202 KB
-
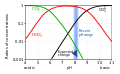
 Carbonate Bjerrum.gif 462 × 290; 9 KB
-
 Carbonate system of seawater mk.svg 540 × 334; 67 KB
-
 Carbonate system of seawater.svg 540 × 334; 23 KB
-
 CCycle cover image.jpg 1,200 × 964; 181 KB
-
 Co2 time series aloha 08-09-2023.jpg 3,238 × 2,526; 2.1 MB
-
 Die Versauerung der Meere Entwicklung der PH-Werte 1850-2100.svg 800 × 640; 10.95 MB
-
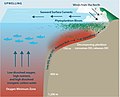 Drivers of hypoxia and acidification in upwelling shelf systems.jpg 1,433 × 1,163; 497 KB
-
 Drivers of hypoxia and acidification in upwelling shelf systems.svg 429 × 348; 635 KB
-
 Effect of Ocean Acidification on Calcification.png 512 × 276; 35 KB
-
 Effect of Ocean Acidification on Calcification.svg 512 × 276; 90 KB
-
 Effect of Ocean Acidification.png 1,858 × 992; 498 KB
-
 Effects of benthic trawling on CO2 emissions and bottom water pH.jpg 1,435 × 1,050; 155 KB
-
.png/120px-Estimated_change_in_annual_mean_sea_surface_pH_from_1770s-1990s_(GLODAP).png) Estimated change in annual mean sea surface pH from 1770s-1990s (GLODAP).png 1,683 × 1,133; 234 KB
Estimated change in annual mean sea surface pH from 1770s-1990s (GLODAP).png 1,683 × 1,133; 234 KB
-
.jpg/120px-Fis01026_(27555118153).jpg) Fis01026 (27555118153).jpg 2,718 × 2,362; 2.43 MB
Fis01026 (27555118153).jpg 2,718 × 2,362; 2.43 MB
-
 Hägg-Diagramm Kohlensäure.svg 474 × 429; 15 KB
-
Impacts of ocean acidification (NOAA EVL).webm 3 min 59 s, 1,920 × 1,080; 21.52 MB
-
 Karbonatsystem Meerwasser de.svg 540 × 334; 23 KB
-
 Karbonatsystem Meerwasser ru.svg 726 × 464; 2 KB
-
 Marine nitrogen cycle under future ocean acidification hu.png 930 × 750; 228 KB
-
 Marine nitrogen cycle under future ocean acidification.jpg 454 × 366; 113 KB
-
 Mean-seawater-ph.png 3,400 × 2,400; 564 KB
-
 Mesocosms Svalbard.jpg 4,288 × 2,848; 1.07 MB
-
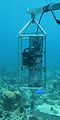
 Oa-buoy-enrique-reef.jpg 1,964 × 1,144; 317 KB
-
 Oa-sami.jpg 799 × 1,600; 152 KB
-
 Ocean Acidification Infographic.jpg 1,981 × 1,500; 537 KB
-
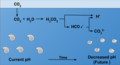
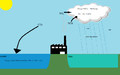
 Ocean Acidification Molecular Process.jpg 1,008 × 779; 171 KB
-
 Ocean Acidification under Low and High Carbon Emission Scenarios.png 625 × 392; 41 KB
-
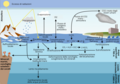
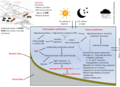
 Overview of climatic changes and their effects on the ocean.png 785 × 550; 184 KB
-
.jpg/120px-People%27s_Climate_March_2017_20170429_4270_(34220546951).jpg) People's Climate March 2017 20170429 4270 (34220546951).jpg 2,218 × 2,218; 1.89 MB
People's Climate March 2017 20170429 4270 (34220546951).jpg 2,218 × 2,218; 1.89 MB
-
 Potential impacts of ocean acidification.png 1,330 × 959; 470 KB
-

-
.pdf/page1-93px-R40143_Ocean_Acidification_(IA_R40143OceanAcidification-crs).pdf.jpg) R40143 Ocean Acidification (IA R40143OceanAcidification-crs).pdf 1,275 × 1,650, 17 pages; 286 KB
R40143 Ocean Acidification (IA R40143OceanAcidification-crs).pdf 1,275 × 1,650, 17 pages; 286 KB
-
 Rhodolith bed physiognomy impacted by warmer and more acidified waters.jpg 2,324 × 2,975; 272 KB
-
 Rise for Climate 237.jpg 1,200 × 2,857; 822 KB
-
.jpg/85px-Save_our_ocean%2C_People%27s_Climate_March%2C_29_April_2017_(cropped).jpg) Save our ocean, People's Climate March, 29 April 2017 (cropped).jpg 1,568 × 2,218; 1.03 MB
Save our ocean, People's Climate March, 29 April 2017 (cropped).jpg 1,568 × 2,218; 1.03 MB
-

-
 Skjermbilde 2023-09-19 kl. 17.39.25.png 1,420 × 1,194; 191 KB
-
 Spatial distribution of global surface ocean pH.webp 1,000 × 773; 126 KB
-
 Surface ocean anthropogenic CO2 concentration, GLODAPv2.png 3,158 × 2,225; 179 KB
-
 Surface ocean pre-industrial DIC concentration, GLODAPv2.png 3,308 × 2,225; 216 KB
-
 Surface ocean present-day DIC concentration, GLODAPv2.png 3,308 × 2,225; 213 KB
-
 Surface ocean present-day omega calcite, GLODAPv2.png 3,167 × 2,225; 188 KB
-
 Surface ocean present-day pH, GLODAPv2.png 3,233 × 2,225; 231 KB
-
 Surface ocean present-day total alkalinity, GLODAPv2.png 3,308 × 2,225; 217 KB
-
.jpg/120px-thumbnail.jpg)
-
 Verzuring.png 1,245 × 777; 49 KB
-
 Victim of Acidification.jpg 700 × 768; 138 KB


.jpg)


.jpg)


.jpg)


.jpg)

