
Category:Charts showing data through 2021
Deutsch: Statistiken bis zu und einschließlich 2021. Viele Grafiken fehlen hier noch – bitte hinzufügen.
English: Charts showing data up to and including 2021.
- Many charts are still missing – please help categorizing charts, e.g. from here. Outdated charts can often be updated. Only charts on notable subjects with specified data source(s) should be included.
| NO WIKIDATA ID FOUND! Search for Charts showing data through 2021 on Wikidata | |
| Upload media |
Subcategories
This category has the following 2 subcategories, out of 2 total.
Media in category "Charts showing data through 2021"
The following 200 files are in this category, out of 549 total.
(previous page) (next page)-
1880- Global warming by latitude zone - NASA - GISS data.webm 47 s, 1,920 × 1,080; 9.64 MB
-
1880- Global warming climate spiral - NASA GISTEMP.webm 1 min 10 s, 1,080 × 1,080; 8 MB
-
 3 waves of opioid overdose deaths. US timeline.png 1,280 × 720; 118 KB
-
 Accumulated Cyclone Energy of North Atlantic hurricanes, OWID.svg 746 × 531; 46 KB
-
 Adoption of communication technologies, World.png 3,400 × 2,400; 506 KB
-
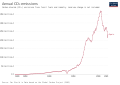
 Annual CO2 emissions by region, 2021.png 3,400 × 2,400; 705 KB
-
.png/120px-Annual-co-emissions-by-region_(OWID_0055).png) Annual-co-emissions-by-region (OWID 0055).png 850 × 600; 81 KB
Annual-co-emissions-by-region (OWID 0055).png 850 × 600; 81 KB
-
 Annual-co-emissions-by-region.png 3,400 × 2,700; 764 KB
-
.png/120px-Annual-co2-cement_(OWID_0052).png) Annual-co2-cement (OWID 0052).png 850 × 600; 48 KB
Annual-co2-cement (OWID 0052).png 850 × 600; 48 KB
-
 Annual-co2-emissions-spain.svg 850 × 600; 44 KB
-
 Bacopa monnieri nootropic publications and citations history from 2004 to 2021.png 1,419 × 1,666; 112 KB
-
 Beef production 1961 2021.png 991 × 579; 41 KB
-
 Best Research-Cell Efficiencies.svg 1,417 × 719; 652 KB
-
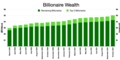 Billionaire wealth.png 1,459 × 724; 219 KB
-
.png/120px-Biofuels-production-by-region_(OWID_0079).png) Biofuels-production-by-region (OWID 0079).png 850 × 600; 73 KB
Biofuels-production-by-region (OWID 0079).png 850 × 600; 73 KB
-
 Bitcoin electricity consumption best-guess estimate.png 3,806 × 2,208; 658 KB
-
 Central African Republic-demography.png 3,400 × 2,400; 271 KB
-
 Change in medical pageviews from 2009.png 618 × 420; 123 KB
-
 Child-mortality-rate-including-un-projections-through-2100.png 3,400 × 2,400; 355 KB
-
 Children-per-woman-UN.png 3,400 × 2,400; 312 KB
-
 ClimateDashboard-global-sea-levels-graph-20230329-1400px.png 1,400 × 1,200; 88 KB
-
 Colombia-demography.png 3,400 × 2,400; 290 KB
-
 Commodity Prices.webp 5,371 × 1,335; 305 KB
-
 Commons app active installs Jul 2021.png 2,896 × 990; 84 KB
-
.png/120px-Corn-production-land-us_(OWID_0242).png) Corn-production-land-us (OWID 0242).png 850 × 600; 73 KB
Corn-production-land-us (OWID 0242).png 850 × 600; 73 KB
-
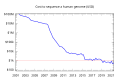
 Cost-of-sequencing-a-full-human-genome.png 3,400 × 2,400; 280 KB
-
 Cote d Ivoire demography.png 3,400 × 2,400; 331 KB
-
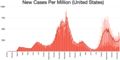 Covid cases per million.webp 1,527 × 762; 88 KB
-
.svg/120px-COVID-19_Southeast_Asia_(log).svg.png) COVID-19 Southeast Asia (log).svg 850 × 600; 176 KB
COVID-19 Southeast Asia (log).svg 850 × 600; 176 KB
-
 COVID-19 Southeast Asia.svg 850 × 600; 112 KB
-
 Covid-19 vaccinations April 24, 2021.png 783 × 536; 29 KB
-
 COVID-19 vaccine doses administered in Laos.svg 850 × 600; 28 KB
-
 COVID-19 vaccine doses administered in Vietnam.svg 850 × 600; 37 KB
-
 Cumulative confirmed COVID-19 cases in Laos.svg 850 × 600; 37 KB
-
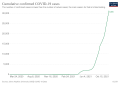
 Cumulative confirmed COVID-19 cases.png 3,400 × 2,400; 322 KB
-
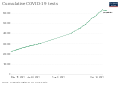 Cumulative COVID-19 tests in Laos.svg 850 × 600; 28 KB
-
 Cumulative COVID-19 tests in Vietnam.svg 850 × 600; 36 KB
-
.png/120px-Cumulative-co2-fuel_(OWID_0217).png) Cumulative-co2-fuel (OWID 0217).png 850 × 600; 52 KB
Cumulative-co2-fuel (OWID 0217).png 850 × 600; 52 KB
-
.png/120px-Cumulative-installed-wind-energy-capacity-gigawatts_(OWID_0210).png) Cumulative-installed-wind-energy-capacity-gigawatts (OWID 0210).png 850 × 600; 71 KB
Cumulative-installed-wind-energy-capacity-gigawatts (OWID 0210).png 850 × 600; 71 KB
-
 Daily COVID-19 vaccine doses administered per 100 people in Laos.svg 850 × 600; 35 KB
-
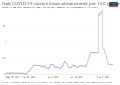
 Daily new confirmed COVID-19 cases per million people in Laos.svg 850 × 600; 37 KB
-

-
 Daily new confirmed COVID-19 cases per million people in Vietnam.svg 850 × 600; 38 KB
-
 Daily new COVID-19 tests in Vietnam.svg 850 × 600; 46 KB
-
 Daily Reply Tool Edits.png 1,358 × 692; 99 KB
-
 Death-rate-smoking, 1990 to 2021, VEN.svg 850 × 699; 18 KB
-
 Death-rate-smoking, 1990 to 2021, ZWE.svg 850 × 699; 19 KB
-
 Deces-covid-nov2020-mars2021.png 3,150 × 3,316; 877 KB
-
-
 Earth-humanity planetary vital signs.jpg 1,725 × 1,750; 632 KB
-
 Electricity generation in South-Africa by source.png 3,400 × 2,765; 757 KB
-
.png/120px-Electricity-mix-uk_(OWID_0381).png) Electricity-mix-uk (OWID 0381).png 850 × 600; 75 KB
Electricity-mix-uk (OWID 0381).png 850 × 600; 75 KB
-

-

-
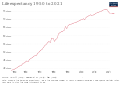
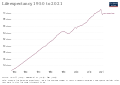
 Energieverbrauch nach Energieträgern, Deutschland, 1965-2021.svg 850 × 600; 57 KB
-
 Energy mix of Ireland.svg 850 × 600; 40 KB
-
 Energy-consumption-by-source-South-Africa.png 2,456 × 2,278; 1.99 MB
-
_of_COVID-19_in_Vietnam.svg/120px-Estimate_of_the_effective_reproduction_rate_(R)_of_COVID-19_in_Vietnam.svg.png)
-
_of_COVID-19_Southeast_Asia.svg/120px-Estimate_of_the_effective_reproduction_rate_(R)_of_COVID-19_Southeast_Asia.svg.png)
-
 Europe top 10 wind power capacity per capita.svg 4,751 × 2,985; 21 KB
-
-
 Food Price Index.webp 1,550 × 452; 76 KB
-
 Gambia demography.png 3,400 × 2,400; 279 KB
-
 GHG emissions by world region, 1850-2021.png 3,400 × 2,400; 800 KB
-
%2C_OWID.svg/120px-Global_energy_consumption_by_source_(substitution_method)%2C_OWID.svg.png) Global energy consumption by source (substitution method), OWID.svg 850 × 600; 46 KB
Global energy consumption by source (substitution method), OWID.svg 850 × 600; 46 KB
-
 Global Energy Consumption tl.svg 960 × 791; 78 KB
-
 Global Energy Consumption.svg 960 × 791; 43 KB
-
 Global meat production.svg 850 × 600; 39 KB
-
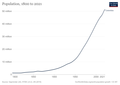
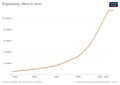
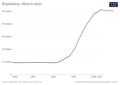
 Global Population, 1300-2021.png 1,636 × 1,012; 145 KB
-
 Global primary energy consumption by source 1900 - 2021.png 3,400 × 2,400; 525 KB
-
.png/120px-Global-change-over-the-last-50-years_(OWID_0467).png) Global-change-over-the-last-50-years (OWID 0467).png 850 × 600; 124 KB
Global-change-over-the-last-50-years (OWID 0467).png 850 × 600; 124 KB
-
.png/120px-Global-co2-emissions-fossil-land_(OWID_0465).png) Global-co2-emissions-fossil-land (OWID 0465).png 850 × 600; 54 KB
Global-co2-emissions-fossil-land (OWID 0465).png 850 × 600; 54 KB
-
.png/120px-Global-co2-fossil-plus-land-use_(OWID_0468).png) Global-co2-fossil-plus-land-use (OWID 0468).png 850 × 600; 63 KB
Global-co2-fossil-plus-land-use (OWID 0468).png 850 × 600; 63 KB
-
.png/120px-Global-energy-consumption-source_(OWID_0461).png) Global-energy-consumption-source (OWID 0461).png 850 × 600; 81 KB
Global-energy-consumption-source (OWID 0461).png 850 × 600; 81 KB
-
.png/120px-Global-energy-substitution_(OWID_0549).png) Global-energy-substitution (OWID 0549).png 850 × 600; 84 KB
Global-energy-substitution (OWID 0549).png 850 × 600; 84 KB
-
.png/120px-Global-hydro-consumption_(OWID_0544).png) Global-hydro-consumption (OWID 0544).png 850 × 600; 45 KB
Global-hydro-consumption (OWID 0544).png 850 × 600; 45 KB
-
 Greenhouse gas emissions in Turkey by sector.png 3,400 × 3,391; 1.38 MB
-
 Growth of Library Genesis, 2009-2022.png 847 × 587; 41 KB
-
 Haiti-demographie.png 3,400 × 2,400; 285 KB
-
 Halogenated gas concentrations 1978-present.png 928 × 598; 24 KB
-
 Histogram of uploads made via Commons app 2021 Q3.png 1,614 × 881; 149 KB
-
 Historic cost of sequencing a human genome.svg 1,200 × 800; 22 KB
-
 Historic population of Algeria.svg 850 × 600; 47 KB
-
 Historic population of Indonesia.svg 850 × 600; 45 KB
-
 Historic population of Italy.svg 850 × 600; 48 KB
-
 Historical population of France.svg 850 × 600; 48 KB
-
 Historical Population of Tunisia.svg 850 × 600; 48 KB
-
.png/120px-Homicide_rates_in_Cyprus_(1990-2021).png) Homicide rates in Cyprus (1990-2021).png 1,718 × 947; 119 KB
Homicide rates in Cyprus (1990-2021).png 1,718 × 947; 119 KB
-
 Honduras-demography.png 3,400 × 2,400; 287 KB
-
 Humans.png 1,600 × 1,773; 250 KB
-
.png/120px-Hydro-consumption-by-region_(OWID_0506).png) Hydro-consumption-by-region (OWID 0506).png 850 × 600; 81 KB
Hydro-consumption-by-region (OWID 0506).png 850 × 600; 81 KB
-
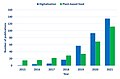
 Immigration to Israel.webp 4,418 × 1,696; 146 KB
-
 India & Delhi daily cases wave comparison.png 1,436 × 871; 141 KB
-
 India versus Delhi daily cases wave comparison with wave numbers.png 1,436 × 871; 164 KB
-
 Infant Mortality Rates - 1950-2021.png 3,001 × 1,251; 376 KB
-
 Infectious-and-parasitic-diseases-death-rate-who-mdb.jpg 3,400 × 3,718; 833 KB
-
.png/120px-Installed-solar-PV-capacity_(OWID_0605).png) Installed-solar-PV-capacity (OWID 0605).png 850 × 600; 56 KB
Installed-solar-PV-capacity (OWID 0605).png 850 × 600; 56 KB
-
 Items-editors.png 922 × 298; 62 KB
-
 Korea-South-demography-ar.png 3,400 × 2,400; 199 KB
-
 Korea-South-demography.png 3,400 × 2,400; 281 KB
-
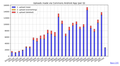
 LibriVox recorded hours by year 2006–2021.jpg 1,564 × 938; 427 KB
-
 LiechtensteinCOVIDCases Feb 22 2021.png 808 × 540; 37 KB
-
 Life Expectancy at Birth 1950-2021.png 2,656 × 1,537; 342 KB
-
 Life expectancy by WBG -Armenia -leader -ru.png 1,297 × 829; 132 KB
-
 Life expectancy by WBG -Armenia -leader.png 1,297 × 829; 131 KB
-
 Life expectancy by WBG -Azerbaijan -leader -ru.png 1,297 × 829; 135 KB
-
 Life expectancy by WBG -Azerbaijan -leader.png 1,297 × 829; 132 KB
-
 Life expectancy by WBG -Belarus -leader -ru.png 1,297 × 829; 138 KB
-
 Life expectancy by WBG -Belarus -leader.png 1,297 × 829; 134 KB
-
 Life expectancy by WBG -China -leader -ru.png 1,153 × 865; 123 KB
-
 Life expectancy by WBG -China -leader.png 1,153 × 865; 118 KB
-
 Life expectancy by WBG -France -leader -ru.png 1,297 × 829; 106 KB
-
 Life expectancy by WBG -France -leader.png 1,297 × 829; 103 KB
-
 Life expectancy by WBG -Georgia -leader -ru.png 1,297 × 829; 136 KB
-
 Life expectancy by WBG -Georgia -leader.png 1,297 × 829; 134 KB
-
_-leader_-ru.png/120px-Life_expectancy_by_WBG_-India_(2)_-leader_-ru.png) Life expectancy by WBG -India (2) -leader -ru.png 1,297 × 829; 139 KB
Life expectancy by WBG -India (2) -leader -ru.png 1,297 × 829; 139 KB
-
_-leader.png/120px-Life_expectancy_by_WBG_-India_(2)_-leader.png) Life expectancy by WBG -India (2) -leader.png 1,297 × 829; 133 KB
Life expectancy by WBG -India (2) -leader.png 1,297 × 829; 133 KB
-
 Life expectancy by WBG -India -leader -ru.png 1,297 × 829; 150 KB
-
 Life expectancy by WBG -India -leader.png 1,297 × 829; 144 KB
-
 Life expectancy by WBG -Kazakhstan -leader -ru.png 1,297 × 829; 136 KB
-
 Life expectancy by WBG -Kazakhstan -leader.png 1,297 × 829; 133 KB
-
 Life expectancy by WBG -Russia -leader -ru.png 1,297 × 829; 145 KB
-
 Life expectancy by WBG -Russia -leader.png 1,297 × 829; 141 KB
-
 Life expectancy by WBG -Saudi Arabia -leader -ru.png 1,297 × 829; 123 KB
-
 Life expectancy by WBG -Saudi Arabia -leader.png 1,297 × 829; 117 KB
-
 Life expectancy by WBG -Turkey -leader -ru.png 1,297 × 829; 136 KB
-
 Life expectancy by WBG -Turkey -leader.png 1,297 × 829; 130 KB
-
 Life expectancy by WBG -Ukraine -leader -ru.png 1,297 × 829; 137 KB
-
 Life expectancy by WBG -Ukraine -leader.png 1,297 × 829; 135 KB
-
 Life expectancy by WBG -United Arab Emirates -leader -ru.png 1,297 × 829; 121 KB
-
 Life expectancy by WBG -United Arab Emirates -leader.png 1,297 × 829; 116 KB
-
 Life expectancy by WBG -United Kingdom -leader -ru.png 1,297 × 829; 120 KB
-
 Life expectancy by WBG -United Kingdom -leader.png 1,297 × 829; 117 KB
-
 Life expectancy by WBG -USA -leader -ru.png 1,297 × 829; 114 KB
-
 Life expectancy by WBG -USA -leader.png 1,297 × 829; 110 KB
-
 Life expectancy by WBG -Uzbekistan -leader -ru.png 1,297 × 829; 121 KB
-
 Life expectancy by WBG -Uzbekistan -leader.png 1,297 × 829; 118 KB
-
 Life expectancy chart for Uganda, OWID.png 1,096 × 755; 58 KB
-
 Life expectancy development in Bangladesh.svg 850 × 600; 32 KB
-
 Life expectancy development in Colombia.svg 850 × 600; 32 KB
-
 Life expectancy development in Cuba.svg 850 × 600; 33 KB
-
 Life expectancy development in India.svg 850 × 600; 33 KB
-
 Life expectancy development in Israel.svg 850 × 600; 32 KB
-
 Life expectancy development in Mexico.svg 850 × 600; 36 KB
-
 Life expectancy development in Niger.svg 850 × 600; 32 KB
-
 Life expectancy development in Nigeria.svg 850 × 600; 32 KB
-
 Life expectancy development in Rwanda.svg 850 × 600; 32 KB
-
 Life expectancy development in South Korea.svg 850 × 600; 32 KB
-
 Life expectancy development in Vietnam.svg 850 × 600; 31 KB
-
 Life expectancy development of the United Kingdom.jpg 801 × 532; 36 KB
-
 Life expectancy in Albania.svg 850 × 600; 32 KB
-
 Life expectancy in Algeria.svg 850 × 600; 32 KB
-
 Life expectancy in Angola.svg 850 × 600; 32 KB
-
 Life expectancy in Argentina.svg 850 × 600; 33 KB
-
 Life expectancy in Armenia and Azerbaija.svg 850 × 600; 39 KB
-
 Life expectancy in Armenia.svg 850 × 600; 32 KB
-
 Life expectancy in Australia.svg 850 × 600; 35 KB
-
 Life expectancy in Austria.svg 850 × 600; 33 KB
-
 Life expectancy in Azerbaijan.svg 850 × 600; 31 KB
-
 Life expectancy in Bangladesh.svg 850 × 600; 32 KB
-
 Life expectancy in Belarus.svg 850 × 600; 32 KB
-
 Life expectancy in Belgium.svg 850 × 600; 42 KB
-
 Life expectancy in Bhutan.svg 850 × 600; 32 KB
-
 Life expectancy in Bolivia.svg 850 × 600; 33 KB
-
 Life expectancy in Bosnia and Herzegovina.svg 850 × 600; 32 KB
-
 Life expectancy in Botswana.svg 850 × 600; 32 KB
-
 Life expectancy in Brazil.svg 850 × 600; 32 KB
-
 Life expectancy in Bulgaria.svg 850 × 600; 33 KB
-
 Life expectancy in Burkina Faso.svg 850 × 600; 32 KB
-
 Life expectancy in Canada.svg 850 × 600; 35 KB
-
 Life expectancy in Chile.svg 850 × 600; 33 KB
-
 Life expectancy in China.svg 850 × 600; 32 KB
-
 Life expectancy in Colombia.svg 850 × 600; 32 KB
-
 Life expectancy in Costa Rica.svg 850 × 600; 32 KB
-
 Life expectancy in Croatia.svg 850 × 600; 31 KB
-
 Life expectancy in Cyprus.svg 850 × 600; 32 KB
-
 Life expectancy in Czechia.svg 850 × 600; 32 KB
-
 Life expectancy in Denmark.svg 850 × 600; 42 KB
-
 Life expectancy in DR Congo.svg 850 × 600; 32 KB
-
 Life expectancy in Egypt.svg 850 × 600; 34 KB
-
 Life expectancy in Estonia.svg 850 × 600; 32 KB
-
 Life expectancy in Ethiopia.svg 850 × 600; 32 KB
-
 Life expectancy in Finland.svg 850 × 600; 39 KB
-
 Life expectancy in France.jpg 786 × 490; 34 KB
-
 Life expectancy in France.svg 850 × 600; 44 KB
-
 Life expectancy in Georgia.svg 850 × 600; 32 KB
-
 Life expectancy in Germany.svg 850 × 600; 32 KB
-
 Life expectancy in Ghana.svg 850 × 600; 32 KB
-
 Life expectancy in Greece.svg 850 × 600; 33 KB
-
 Life expectancy in Hungary.svg 850 × 600; 33 KB
-
 Life expectancy in Iceland.jpg 814 × 490; 38 KB
-
 Life expectancy in Iceland.svg 850 × 600; 43 KB
-
 Life expectancy in Indonesia.svg 850 × 600; 32 KB
-
 Life expectancy in Iran.svg 850 × 600; 32 KB
-
 Life expectancy in Ireland.svg 850 × 600; 32 KB
-
 Life expectancy in Italy.svg 850 × 600; 39 KB
-
 Life expectancy in Ivory Coast.svg 850 × 600; 32 KB
-
 Life expectancy in Japan.svg 850 × 600; 34 KB
-
 Life expectancy in Kazakhstan.svg 850 × 600; 32 KB
-
 Life expectancy in Kyrgyzstan.svg 850 × 600; 32 KB


.png)

.png)


.png)


.png)


.svg)


.png)
.png)


.png)


_of_COVID-19_in_Vietnam.svg)
_of_COVID-19_Southeast_Asia.svg)


,_OWID.svg)


.png)
.png)
.png)
.png)
.png)
.png)


.png)


.png)


.png)


_-leader_-ru.png)
_-leader.png)


